Analysis of Three-dimension Viscous Flow in the Model Axial Compressor Stage K1002L
K Tribunskaia and Y V Kozhukhov
Abstract. The main investigation subject considered in this paper is axial compressor model stage K1002L. Three simulation models were designed: Scheme 1 – inlet stage model consisting of IGV (Inlet Guide Vane), rotor and diffuser; Scheme 2 – two-stage model: IGV, first-stage rotor, first-stage diffuser, second-stage rotor, EGV (Exit Guide Vane); Scheme 3 – full-round model: IGV, rotor, diffuser.
Numerical investigation of the model stage was held for four circumferential velocities at the outer diameter (Uout=125,160,180,210 m/s) within the range of flow coefficient: φ = 0.4 – 0.6. The computational domain was created with ANSYS CFX Workbench.
According to simulation results, there were constructed aerodynamic characteristic curves of adiabatic efficiency and the adiabatic head coefficient calculated for total parameters were compared with data from the full-scale test received at the Central Boiler and Turbine Institution (CBTI), thus, verification of the calculated data was carried out. Moreover, there were conducted the following studies: comparison of aerodynamic characteristics of the schemes 1, 2; comparison of the sector and full-round models.
The analysis and conclusions are supplemented by gas-dynamic method calculation for axial compressor stages.
Nomenclature
R- rotor;
S – stator;
IGV – inlet guide vane;
EGV – exit guide vane.
=local axial velocity; ms-1
= flow path area; m3
= head; kgs-1
= flow rate; kgm-1s-1;
n = compressor speed (rotation velocity); s-1; (rev min-1😉
P = static pressure; Pa
r = radius; m
= relative radius;
= local blade velocity; m/s (In paper: blade velocity at the outer diameter);
= efficiency; efficiency coefficient;
— degree of reaction;
= stage flow coefficient (In paper: stage flow coefficient calculated for total parameters);
= head coefficient (In paper: adiabatic head coefficient calculated for total parameters)
ε = degree of turbulence
Subscripts
ad = adiabatic;
av = average
c = calculated parameter;
out = outer(in stator diameter);
T = theoretical;
1,2 = first stage and second stage in case of rotor and stator.
Superscripts
*- total parameters
- Introduction
1.1. Full-scale experimental equipment
The full-scale investigation conducted at the Central Boiler and Turbine Institution (CBTI) was carried out for axial compressor stage`s with flow path designed constant outer diameter and variable inner diameter (type I) and degree of reaction 1.0.
The test stand was completed with compressor rotor (cantilevered disk) rotated by an electric motor via a step-up gear. The disk was made compound, it allows attaching a variety of blades and changing the angle of installation. The compressor stator has an annular air intake from surrounding space and two removable guide vanes to model various types of stages: intermediate, first and last one. The vertical flange of the compressor connects with the horizontal pipe. The throttle valve was installed at the end of the pipe allowing to measure the hydraulic resistance of the air intake system (pipe + throttle). The throttle aperture (flow nozzle) was installed in the same pipe, which allowed measuring the flow rate through the compressor. The changing of the impeller rotation speed was achieved by changing the of electric motor speed. Rotor speed was defined by a mechanical or electrical tachometer. The gas temperature was measured with a thermometer at the inlet, and a thermometer or thermocouple at the outlet. Atmospheric pressure was measured by barometer. The static gas pressure at the internal surfaces of the cylinder was determined using a U-shaped manometer through holes specially drilled. The pressure and the gas velocity value and direction in the gaps measured with special aerodynamic devices introduced into the flow path through the hole in the cylinder wall between the blades before and after the stage are. For the characteristics of the intermediate stage used measurements of the velocity field in front of the impeller and after guide vane [4].
The experimental data was presented by the adiabatic head coefficient calculated for total parameters:
and the adiabatic efficiency:
calculated for stage flow coefficient [1,3]:
| . |
1.2. Computing model
Based on the research description made by of CBTI [1, 3] four 3D blade models were designed, namely IGV, rotor (R), diffuser (S), EGV. The models geometry were developed in Creo (PTC). This paper presents the investigation of the three calculation schemes: scheme 1, consisting of IGV, R1, S1, R2, EGV (Fig. 1); scheme 2, consisting of IGV, R, S (Fig. 2); scheme 3 full-round model, also consisting of IGV, R, S (Fig. 3). The stage geometry parameters are given in the Table 1.
Table 1. Model stage geometric parameters
| Flow path parts | Dimension | IGV | R | S | EGV | |||||
| Outer diameter | mm | 250 | 250 | 250 | 250 | |||||
| Inter diameter | mm | 125.0 | 126.1 | 130.3 | 130.3 | |||||
| Length of the blade at the entrance | mm | 62.5 | 61.6 | 59.85 | 59.85 | |||||
| Length of the blade by the section | mm | 12.50 | 12.32 | 11,97 | 11.97 | |||||
| Blade chord | mm | 30 | 30 | 30 | 30 | |||||
| Number of blades in the crown | pcs | 26 | 21 | 28 | 26 | |||||
| Radial clearance | mm | — | 0,57 | — | — | |||||
| Axial clearance | mm | 24 | 24 | 24 | 0 | |||||
|
|
||||||||||

Figure 1. Scheme 1: Flow path consisted of IGV, R, S
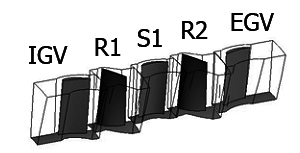
Figure 2. Scheme 2: Flow path consisted of IGV, R1, S1, R2, EGV

Figure 2. Scheme 2: Flow path consisted of IGV, R1, S1, R2, EGV
The calculations were obtained with ANSYS Workbench 14.0. For simulation of the computing domain it was used a high sample rate mesh with the number of nodes up to 500 000 per each sector of blade row. The degree of turbulence at the inlet of the computational domain was taken ε = 5%. Total pressure and total temperature at the inlet, the mass flow rate at the outlet were taken as the boundary conditions.
Model of turbulence used in the study is SST (Shear-Stress-Transport)
- Numerical method and the obtained results
2.1. Comparison of CFX and full-scale experiments
The First part of the investigation includes the comparison between the results received from sector CFX calculation (Scheme 1) and the full-scaled CBTI experiment.
The main calculated parameters were measured before the first rotor and after the following diffuser (in the section where the flow has not turn in the axial direction).
The stable work zone was accepted as a part of characteristic near the max efficiency mode, where the estimated parameters are different from the maximum no more than 5%.
The relative error, expressed in a percentage was determined as:
| (4) | ||
| (5) |
Fig. 4-5 illustrates the set of aerodynamic adiabatic efficiency characteristic and adiabatic total head coefficient (;) (1), (2) depending on the stage flow coefficient (3).
Based on the obtained results there were concluded that with the increase of blade local velocity at the outer diameter (from 125 to 210 m/s) the investigated parameters (;) are offset from the stable work zone to the right by 10% on average, the point of maximum efficiency also moves to the right.
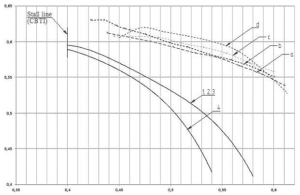
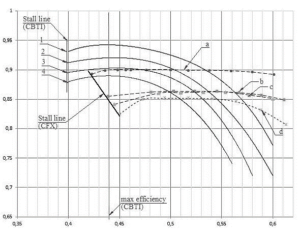 Figure 4. Adiabatic efficiency characteristics for the full-scale and the CFX experiments
Figure 5. Adiabatic head coefficient calculated for total parameters for the full-scale and the CFX experimentsMax numerical values of aerodynamic characteristics are less dependent on blade velocity at the outer radius (Uout,) i.e., compressor speed, this is indicated by «flattening» of the characteristics on the chart. Thus, the obtained values of the efficiency and head coefficient for the Uout = 160, 180, 210 m/s are quite close. There is overestimation of the CFD-calculation of head coefficient: the difference from the full-scale experiment is 15% on average in the stable work zone.
2.2. The impact of multi-stage on the characteristics of the first stage
In multi-stage compressor the crowns following the first stage impact on it operating [5]. The main task of this investigation was to determine the impact of additional crowns on the aerodynamic characteristics of the first stage in the CFX experiment and compare findings of one-stage (Scheme 1) and two-stage (Scheme 2) models. The reference sections for Schemes 1, 2 were coincide.
Figures 6-9 depict the aerodynamic characteristics: (;,) marked by the surge line; the vertical lines intersect the characteristics at the maximum efficiency point (direct mode).
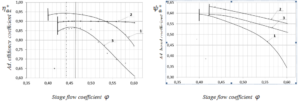
Figure 6. Aerodynamic characteristics of CFX (Scheme1,2) and full-scaled experiments calculated for
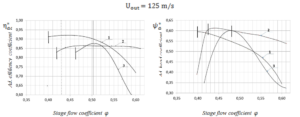
Figure 7. Aerodynamic characteristics of CFX (Scheme1,2) and full-scaled experiments calculated for
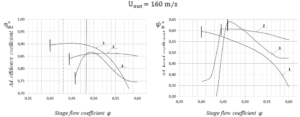
Figure 8. Aerodynamic characteristics of CFX (Scheme1,2) and full-scaled experiments calculated for
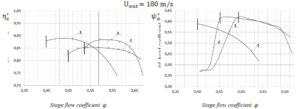
Figure 9. Aerodynamic characteristics of CFX (Scheme1,2) and full-scaled experiments calculated for
Table 3. Comparison of CFX (Schemes 1, 2) and full-scale investigations
| Blade local velocity at the outer diameter, , m/s | φ | Full-scale | CFX, Scheme 2 | CFX, Scheme 1 | |||
| 125 | 0.461 | 0.940 | 0.576 | 0.865 | 0.589 | 0.900 | 0.616 |
| 160 | 0.506 | 0.899 | 0.520 | 0.87 | 0.587 | 0.863 | 0.592 |
| 180 | 0.488 | 0.896 | 0.550 | 0.865 | 0.614 | 0.860 | 0.606 |
| 210 | 0.521 | 0.830 | 0.470 | 0.888 | 0.609 | 0.852 | 0.608 |
One-stage model (Scheme 1) has larger stable work zone in contrast to the two-stage model (Scheme 2). The efficiency characteristics appearance (Scheme 1) more similar with the characteristic obtained in the full-scale experiment CBTI. However, the overestimation of the adiabatic head coefficient occurs. For the Scheme 1 max efficiency values are closer correlated with the full-scale experiment data. The difference between them on Uout = 125,160,180 m/s modes is less than 7%. Similarly, for Uout = 210 m/s mode it is less than 2%. Difference of values varies from 6 to 30%. With the outer blade velocity increasing the surge line offsets to the right for all sector schemes, reach large displacement for Scheme 2 (Table 4).
For the Scheme 2 max efficiency values at the Uout= 160,180 m/s modes are less than full-scale experiment at the same modes nearly by 3%. At the same time for Uout= 125, 210 m/s modes this difference is up to 7,5%. From the over hand the distinction between adiabatic head coefficient max value runs up with outer blade velocity increasing from 6% for Uout= 125m/s to 30% for Uout= 180 m/s.
Table 4. Comparison of flow coefficient on the surge edge for full-scale and CFX (Scheme1,2)
| Blade local velocity at the outer diameter, , m/s | Flow coefficient on the stall line | |||
| Full-scale | CFX | |||
| Scheme 1 | Scheme 2 | |||
| 125 | 0.4 | 0.425 | 0.425 | |
| 160 | 0.4 | 0.419 | 0.465 | |
| 180 | 0.4 | 0.445 | 0.485 | |
| 210 | 0.4 | 0.450 | 0.486 | |
2.3. Comparison of aerodynamic characteristics of the sector and the full-round models
According to the axial symmetry of axis turbomachines, it is usual practice to solve the problem of flow simulation by examining only one sector. However, since a certain approach to the exact solution of this problem is not found, researchers are increasingly turning to the full-round models. [2] Figures 10-13 show the characteristics of efficiency and adiabatic head coefficient for the sector and the full-round models.
The difference between full-round and sector models max efficiency coefficient ( ) values is 3% at the each direct mode. In the same for adiabatic head coefficient this value is up to 5% (Table 5). This indicates that full-round and sector calculation schemes are quite close and sector models can substitute full-round for initial examination of workflow.
From the other hand the solution of the one design point takes two timed longer than sector solution and 10 times more computer memory space.
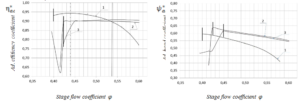
Figure 10. Aerodynamic characteristics of CFX (Scheme1,3) and full-scaled experiments calculated for
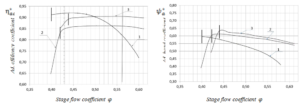
Figure 11. Aerodynamic characteristics of CFX (Scheme1,3) and full-scaled experiments calculated for

Figure 12. Aerodynamic characteristics of CFX (Scheme1,3) and full-scaled experiments calculated for
Table 5. Comparison of the full-scale and the CFX experiments.
| Blade local speed at the outer diameter, , m/s | φ | Full-scale | Scheme 3 | Scheme 1 | |||
| 125 | 0.538 | 0.900 | 0.499 | 0.907 | 0.577 | 0.899 | 0.582 |
| 160 | 0.567 | 0.820 | 0.460 | 0.905 | 0.580 | 0.861 | 0.566 |
| 180 | 0.488 | 0.892 | 0.54 | 0.899 | 0.622 | 0.860 | 0.606 |
| 210 | 0.521 | 0.830 | 0.470 | 0.890 | 0.621 | 0.851 | 0.600 |
- Results and Discussion
Thus, on the basis of the obtained results can be drawn the following conclusions:
The aerodynamic characteristic set of efficiency coefficient () and adiabatic head coefficient () for the sector CFX schemes are closely match at the design modes (efficiency max value) and in the stable work zones. The differences between them 7% on average. However, at the critical modes and at the characteristic ends they are quite distinct due to next stage impact and raising of the backlog angles with flow rate increase.
There is the offset of stable work zone to the right; stage parameters are less dependent on increase of the outer blade velocity , whereby the characteristics «flattering» to each other; maximum efficiency points are shifted to the right as well.
The miscalculation between the full-scale and CFX experiments is slightly dependent on the outer blade velocity. The calculated efficiency value on average 5% less than full-scaled, however, the head coefficient up to 13% higher.
There is overestimate of the backlog angles by the ANSYS CFX software for the two-stage model that allows to conclude: that the smaller the blade rows is calculated together, the more accurate calculation is obtained.
Overall, the CFX experiment showed the miscalculation in the stable work zone for up to 6% for efficiency and up to 18% for the adiabatic head coefficient. This suggests the possibility of taking such numerical experiments for stage flow analysis, but with the insertion of the variance for axial compressor stages in the design conditions (within the stable operation), however, the application of this method in critical modes will not give accurate results.
Turbulence model used in the research is SST, but the calculation of one point cannot give a fair view of the impact of the turbulence model on the obtained characteristics.
References
[1] Buinovskia L N Comparison of experimental and calculated aerodynamic characteristics of axial compressors Kotloturbostroenie. Proceedings CBTI 51. Gas turbines. Ed. Acad. B. E. Stechina, et al. — Leningrad, 1964. 10 P.
[2] Galerkin Y B, Soldatova K V, Titensky V N Theory, calculation and design of compressor dynamic machines. Turbochargers. — Textbook. — St. Petersburg: SSTU, 2007. — 142 p.
[3] The methodology for calculating the aerodynamic flow of the axial compressor for fixed installations. RTM 24.020.17-73. — Moscow, 1973 — 205 p.
[4] Guidelines for the calculation of aerodynamic flow of the axial compressors. Atlas initial stages. — Leningrad, 1957 — 8 p
[5] Seleznev K P, Podobuev Y S Theory and calculation of axial and centrifugal compressors. — Leningrad: Engineering literature, 1957 — 395 p.


