The methodology for the existing complex pneumatic systems efficiency increase with the use of mathematical modeling
A.M. Danilishin1, S.V. Kartashov1, Y.V. Kozhukhov1 and E.G. Kozin2
Absrtact. The method for the existing complex pneumatic systems efficiency increase has been developed, including the survey steps, mathematical technological process modeling, optimizing the pneumatic system configuration, its operation modes, selection of optimal compressor units and additional equipment. Practical application of the methodology is considered by the example of the existing pneumatic systems underground depot reconstruction. The first stage of the methodology is the survey of acting pneumatic system. The second stage of technique is multivariable mathematical modeling of the pneumatic system operation. The developed methodology is applicable to complex pneumatic systems.
Introduction
The increase efficiency technique of complex pneumatic systems is developed. It includes inspection stages, mathematical modeling of engineering procedure, pneumatic system optimization, operational mode, optimum compressor installations selection and service equipment. In terms of energy efficiency and reliability of compressed air supply the offered technique makes it possible to develop the optimum scheme for the existing pneumatic systems at their reconstruction and again designed pneumatic systems of industrial facilities.
The first technique stage is technological audit of the operating pneumatic system [1]. Inspection consists of collecting statistical data, visual and tool inspection, definition of the pneumatic system actual configuration. The second stage is multiple mathematical modeling of pneumatic system work. Calculations are carried out on the mathematical model, which underwent validation on the operating pneumatic system. The system is formed from the certain pipeline sections of compressed air supply with their optimum diameters calculation. The optimum configuration is defined with topology of the area and operation requirements. Numerical work modeling of pneumatic system separate elements is carried out using computational gas dynamics methods. In addition, their optimum configuration in terms of technological and economic problems is selected. At the final stage the scheme of a pneumatic system with the compressor and service equipment selection is formed. It takes into account compressor reservation and recommendations about the operation modes.
Subject of research
Practical technique application is considered on the example of the St. Petersburg Metropolitan depot pneumatic systems reconstruction. The St. Petersburg Metropolitan incorporates 6 depots, each one is equipped with a low pressure pneumatic system (up to 10 bars). Depot pneumatic systems represent an object with the following characteristics and features of operation. Pneumatic system powered by compressed air from the main compressor station. The Compressor Station (CS) with hangar compressors placing is located in single heated machine hall and equipped with 4 or 5 volume action compressors. By now all previously set many years ago piston compressors replaced with modern oil-injected screw compressors. Each depot has various compressed air consumers with different requirements to its pressure, flow and quality. The main groups of compressed air consumers in each depot and their main characteristics are shown in table 1.
Table 1. The main groups of compressed air consumers in each depot and their main characteristics.
| Consumer | Type of use | Usage time | Pressure (not less) bar; cleaning class; dew-point temperature, °C |
| Train depot | Filling wagons with compressed air, airflow technical, pneumatic tools, pneumatic testing equipment stands | year-round | 7; 1; -40 |
| Track fan
|
Snow blowdown of railroad switches in the automatic and manual modes | snow period | 6; 1; -40 |
| Technical services and divisions | Technical blowing, pneumatic tools, machines and etc | year-round | 6; 1; -40 |
The necessary condition is any time compressed air supply warranty of the required consumer parameters on important sectors regardless operation modes at other consumption points. The most responsible in terms of the passenger transport safety is the train depot where the refueling is carried out with compressed air of wagon brake systems. Because the bringing into work of the braking system, opening and closing doors, and others provided with compressed air.
Technological audit
А pneumatic system technological audit called also by pneumoaudit is the integral stage at its reconstruction, at normal working capacity restoration of the existing or a new pneumatic system construction. Pneumoaudit essence is to conduct comprehensive, detailed, instrumental and statistical state survey and pneumatic system in general and objects particularly of their collaboration in a single system. Based on such an audit at the following stages are offered measures for improving the existing pneumatic system operation or developing a new basic scheme of air supply and air preparation, which will improve the reliability and energy efficiency of compressed air considering consumers pneumatic operation features. At the stage of a pneumatic parameters statistical survey documentary data about compressor settings consumption of energy, air consumption, technical air parameters, operation (seasonality) modes, which need to be considered when calculating pneumatic system efficiency collected and analyzed. Then, the experimental researches of workflows and acting pneumatic system modes held. Visual and instrumental observations are conducted according to the specially developed for the object program and the method of examination. The basis of the program and the survey methodology are the provisions contained in the sources [2, 3]. The inspection technique consists in carrying out visual assessment with photo video fixing of the actual pneumatic system wear, measurement and registration of pneumatic system characteristics by stationary and portable devices on the set modes of behavior. A tool measurements series of pneumatic system work parameters carried out on various modes. The generation balance and compressed air consumption is analyzed on condition guaranteed provision needs of resource consumers. In conducting research pressure values in pneumatic control points are measured, the values costs are determined, the pressure change dynamics at operating change modes for different consumption branch of system is fixed and air leaks on defective places of a pneumatic system are measured.
At the time of carrying out inspection in all depots pneumatic system had the general collector to which the compressor station gives compressed air. From the general collector there is an air bleeding to each of consumers who have different requirements to pressure and quality of compressed air. In this regard, air consumption by any consumers exerts impact on parameters of the given air to other consumers. It can negatively affect the functioning certain consumers up to consequences in the form of failures in the rolling stock work on the line. Let us consider pneumoaudit results on the example of one-surveyed depots – «Nevskoye» depot as inspection results are in a varying degree characteristic also of other surveyed depots. It should be noted that now for «Nevskoye» depot all specified defects of a pneumatic system condition are eliminated by results of the described works. As a visual inspection result of pneumatic system, the depot «Neva» found to be satisfactory pipeline condition from the compressor station before entering into depot building, on washing where the drainage of railway carriage by compressed air after washing is made, and to a railway upshot, characterized by lack of escapes. The unsatisfactory condition of the line pipes found in the train depot building with constant significant leaks about 8 m3 / min (see. below Fig. 4) due to leakage of the connecting device to the pneumatic electric trains brake system. In addition, considered unsatisfactory electro-valves state in the automatic blowing shooter system with a constant leak value, determine the value of which is difficult due to the absence of valves.
Inspection by a tool mode of generation system and compressed air distribution for needs of «Nevskoye» depot was made on these actual conditions:
- The mode No. 1 – the consumer: only the depot building, the size of inlet pressure to the building of depot was measured and an exit from compressor station, the expense from escapes was also measured in the depot building. The schedule of pressure drop is represented in fig. 1;
- The mode No. 2 — the consumer: escapes in the depot building, the inlet pressure size was measured in the depot building and an exit from compressor station, the volume of escapes was determined (by an expense) in the depot building, air supply in depot is stopped. Within 10 minutes pressure falls from value of 7,0 bars to 6,0 bars;
- The mode No. 3 — the consumer: escapes in the washing building, the size of inlet pressure on washing was measured, the expense was measured, air supply on washing is stopped. Within 5 minutes pressure falls from value of 6,3 bars to 5,6 bars;
- The mode No. 4 — the consumer: depot building and a railway upshot without arrows blowing, the size of inlet pressure to the depot building, an exit from compressor station, on a traveling fan was measured, the expense was measured. The schedule of pressure drop is represented in fig. 2;
- The mode No. 5 — the consumer: the depot building, a railway upshot at the engaged automatic arrows blowing, the size of inlet pressure to the depot building, an exit from compressor station, on a traveling fan was measured, the expense was measured. The schedule of pressure drop is represented in fig. 2;
- The mode No. 6 – the consumer: the depot building, a railway upshot at the engaged automatic and manual arrows blowing, the size of inlet pressure to the depot building, an exit from compressor station, on a railway upshot was measured, and the expense was measured. The schedule of pressure drop is represented in fig. 2;
- 7 The mode No. 7 – the consumer: the depot building, a railway upshot at the engaged automatic arrows blowing was measured, the new receiver of 3,2 m3 is connected, the size of inlet pressure to the depot building, an exit from compressor station, on a railway upshot and the expense was measured. The schedule of pressure drop is represented in fig. 3;
- The mode No. 8 — the consumer: depot and washing building, the size of inlet pressure on washing was measured, the expense was measured. Within 7 minutes pressure falls from value of 7,0 bars to 6,0 bars.
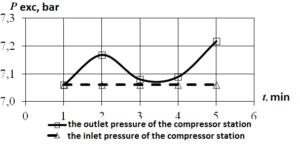
Fig.1. Pressure drop on the mode №1: the consumer is only the depot building
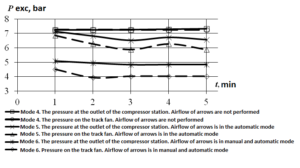
Fig.2. The pressure drop in the modes: №4 — leakage for the track fan; №5 — track fan with automatic blasting; №6 — track fan with manual and automatic blasting
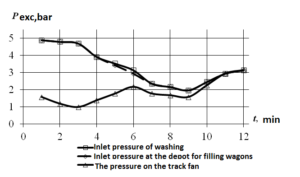
Figure 3. Pressure drop on the mode №7: track fan with automatic switches and blasting work by a compressor connected to the air tanks with a capacity of 3.2 cubic meters
From the analysis of graphs, the following conclusions can be made:
- According to the general recommendations the value of the pressure drop in the section of the pipeline from the compressor station to the consumer must not exceed 0.1 bar. In the studied areas the exceeding of this value has been recorded at startup of the airflow fan of the arrows from 0.5 to 1.0 bar (Fig. 2). For threads depot the pressure drop is within 0.1 bar (Fig. 1). For washing thread manometer has not been installed directly at the consumer due to the absence of the mounting fitting in the pipeline. However, by the assess of the manometer, which is set for the washing thread immediately following branching to the sink the pressure drop at a given part of the pneumatic pipeline between the manometers is less than 0.1 bar.
- At the maximum air consumption on the directional fan the pressure decreases across the network below the normal value for a significant — about 2 — 5 bar depending on the combination of the included consumers(figure 3.). This makes it impossible to fully fill the braking system of the wagon, which can lead to failure of work of the rolling-stock on the line when the air pressure is insufficient for uncompressing brake blocks after a stop at the station.
- For all pneumatic pipelines consumers except for washing, there are recorded air leakages.
From this analysis it follows that the system of pneumatic pipelines airflow fan generates resistance above the recommended values and the pneumatic system generally is organized without taking into account the features of using the technology resources by the consumer and requirements to ensure the required reliability parameters of compressed air.
In Figure 4 shows the dependence of generation of compressed air by the compressor station at the time when the washer does not work, the fan is turned off, and the depot is not loaded to full capacity (not 100%). Data has been recorded at a minute interval
Figure 4. The cycle diagram of generation when working at the depot, the wash does not work, the fan is turned off.
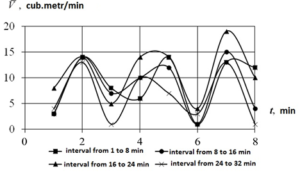
Figure 4. The cycle diagram of generation when working at the depot, the wash does not work, the fan is turned off.
The analysis of the graphs in Fig. 4 shows that at this mode consumption figures are having pulsating character with traceable cyclic pattern. This curve form can be explained by the fact that there is considerable leakage of the network, which is an average value of about 8 m3 / min. It is known that in the general purpose air networks in the presence of only one pipe hole about 5 mm in diameter leads to leakage to 2 m3 / min and 10 kW power lost [2].
Leakage value given to the conditions of the suction can be determined by the formula:
Where Vp — the total volume of the network, determines the amount of pipelines, m3; pmax, pmin — maximum and minimum pressure in the system, a bar; t — duration of the deflation process, min.
Thus, from Fig. 4 it follows that pneumatic system works in the following mode. The compressor supplies compressed air to the network to set pressure, in the absence of compressed air consumers (fully or partially), the compressor switches to the control mode with of compressed air discharge into the atmosphere.
After the pressure in the network decreases till the minimum established value at the compressor, the latter switches to the nominal mode of generation and again supplies air to the network. The graph (Fig. 4) the frequency of such work is approximately 2-3 minutes. Thus, for a long time, compressed air is only consumed to fill leaks.
Figure 5 shows graphs of the four-year period the electricity consumption of the compressor station from 2010 to 2013.
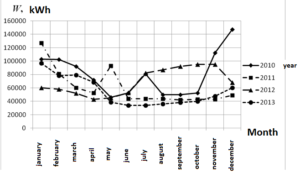
Figure 5. The monthly energy consumption by years
From the graphs in Fig. 5 it is clear that, depending on the season, the consumption of electric energy may vary by several times. The number of simultaneously working compressors varies by month and can be calculated on the basis of the data of Fig. 5 according to the formula:
H = E / Ek,
where H — the number of compressors; E — actual energy consumption (kW × h × number of days in the month × 24 hours a day); Eck — Nominal power consumption with one compressor (Ek = 110 kW × h × number of days in the month × 24 hours a day.).
The calculation shows that, in general, one compressor is working, and sometimes in winter the second one was activated. This is due to the increased air intake fan on a snowy day.
An important indicator in assessing the pneumatic mode is its maximum peak load when switched on simultaneously all consumers of compressed air. The warranty of supplying all consumers with simultaneous operation of the air with necessary parameters ensures the reliability of the entire pneumatic system. Based on these data, there were obtained the highest possible average hourly expenditure of compressed air in three consumers (see. Table 2) and suggested compressor station equipment with redundancy for depot «Neva» (see. Table 3). It is recommended to use the central control system (CCS), possess the function coordination of the compressors work together to regulate the work of the compressor station.
Table 2. Maximum hourly flow rate
| Consumer | The nature of using | The maximum flow rate, m3 / hour (m3 / min) |
| Train depot | Filling electric brake systems, technological needs. Not allowed excessive pressure drops below 6.5 bar, high demands for clean air | 480 (8) |
| Track fan | A rinsing of turnout switchers | 1800 (30) |
| Motodepot | Drying wagon, technological needs | 1020 (17) |
| Total consumption | 3300 (55) | |
| Total from the perspectives of the depot and the provision development | 4320 (72) | |
Table 3. Offered equipment of compressor stations by compressor units
| Consumer | Compression type | Max Prod. m3 / min | Drive power kW | System of regulation |
| Train depot | screw oil-filled | 12 | 75 | Frequen. conversion |
| Track fan | screw oil-filled | 29 | 160 | Frequen. Conversion., Periodic starts and stops |
| Motodepot | screw oil-filled | 19 | 110 | Frequen. conversion |
| Reserve | screw oil-filled | 19 | 110 | Periodic starts and stops |
The described technological audit carried out for all the metro depot considering the characteristics of each of them on the composition of the equipment and engineering process. The next step in offered the methodology is to develop a concept of air supply to the definition of the optimal pipeline diameter, topology map, taking into account the operating conditions at the facility based on the energy efficiency requirements and the reliability of the air supply.
Mathematical modeling
At this stage, there are holding the multivariable configuration and settlement and analysis of operation compressed air networks based on the data obtained by using statistical and instrumental examination, developing a mathematical model of pneumatic systems. In connection with the various parameters of air consumed by consumers and the inadmissibility of pressure drop on the branch of the refueling wagon (Fig. 3), it is proposed the division of pipelines to consumers. In this way, the supply of compressed air to each of the consumers is done by isolated from other consumers pipeline and manufactured from a single compressor. Air supply remains centralized. In this case pneumatic system is configured so that if necessary either compressor can be replaced by any other without necessarily reserve by appropriate combinations of open and closed valves. The implementation of the described concept provides localization of all compressors in the same service room — already equipped with a specialized site. Therefore there is no need to conduct a detailed analysis of the local localization of compressors (modular accommodation) for consumers, as it is in connection with a separate service facilities, will make further organizational expenses in the process of controlling the operation of pneumatic system, not to mention the preparation of deployment sites compressor units directly from consumers. Following the regulatory documents [4 — 6], the implementation of the solution described in the technical re-equipment provides localization contours pipelines of all compressors in the same service rooms, while providing for each consumer the desired class of air cleanliness and control flexibility of pneumatic system as a whole.
Example for the proposed reconstruction of the concept of air supply is shown in Figure 6.
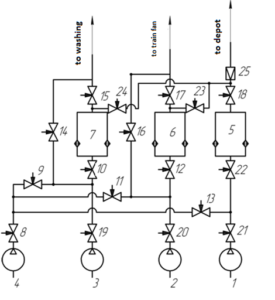
Figure 6. The basic diagram of the air supply for reconstruction
1, 2, 3 — the main compressor units with frequency converters, and built-in coolers and moistures; 4 — Reserve compressor unit; 5, 6, 7 — drying units with a fine filter; 8 — 24 — stop valves; 25 — Check Valve
It creates a mathematical model developed to optimize the air supply circuit, the main provisions of which are listed below.
In order to determine the loss ΔP in the area, the following formula (1), combining the amount of friction loss and the amount of loss due to local resistance (valves, faucets, outlets, a sudden expansion, sudden narrowing, etc.):
, [Pa] (1)
In order to determine friction the loss following formula is used Darcy-Weisbach [2]:
, [Pa] (2)
In the formula (2) λ is the coefficient of resistance, l — length of the section of the pipeline, [m]; c — velocity of the medium in the pipeline, [m/s], ρτ-line pressure, [Pa], Dps — the diameter of the pipeline section, [m].
To calculate the coefficient of resistance is used empirical formula Blasius (3) and Nikuradze (4) designed to calculate a hydraulically smooth pipes:
(3)
(4)
(5)
ν- the kinematic viscosity of the medium, [m2/s].
Equation (3) is used in the case of contact with the Reynolds number in the range from 3000 to 7000, the formula (4) when getting the Reynolds number in the range from 105 do107.
The flow velocity is determined from the mass flow equation:
, [m/s] (6)
In order to determine the loss of local resistance using a modified formula of Darcy-Weisbach:
, [Pa] (7)
In the formula (7) ζ — the local resistance coefficient is determined by empirical dependencies of the manual on water connections I.E Idelchik [7].
Because the at the site there are long term operation pipes, and it is impossible to reliably determine the roughness of the inner surface of the tube, changing in course of time due to corrosion and wear and tear of the material, then for the above formulas is introduced the correction factor for the roughness of the k, defined as a result of instrumental examination optimized pneumatic systems (in this case, its value is k = 1,22). As the pipes wear out in course of time, this factor will allow an increase in pressure in advance to prevent losses in the pipeline sections.
Based on the above key provisions there is developed the program code of the mathematical model written in C ++. In the program code there are implemented data entry modules, graphical results of the analysis modules (Fig. 7). Progress of work with the program is conducted as follows:
- The program loads pneumatic configuration with an indication compressed gas of interest to consumers.
- In the window «calculation» is performed on the data input pressure at the outlet of the compressor station and flow rates of interest to the consumer.
- In the «Results» is produced the issuance of calculation indicating the differential pressure between the compressor station and the consumer.
- In the pneumatic system configuration changes are made (configuration, length and diameter of the pipeline) and the calculation is made again to achieve an acceptable level of losses.
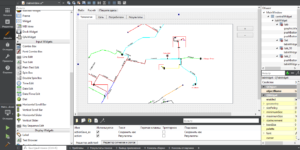
Figure 7. The windows of the program for pneumatic system data entry
Further, if necessary, is produced entirely mathematical modeling of the pneumatic or its components separately using computational techniques of gas dynamics software package Ansys CFD by calculation with a viscous gas. Modeling elements are subject fittings, hose blowouts switches paths nozzle apparatus blower hoses, etc. By results of modeling there is produced optimization of these elements.
Conclusions
The proposed method of increasing the efficiency of existing and newly designed complex pneumatic systems with the use of mathematical modeling is used at the stage of pre-design engineering of industrial facilities. The technique allows to develop a pneumatic system that ensures energy efficiency reliability and flexibility of its exploitation and the subsequent modernization in connection with the expansion of production.
References
[1] Kozin E. G., Kozhukhov Y. V. “Technological audit pneumatic system as a step in the process of its reconstruction” // Scientific and technical statements STU. Vol. 2 (243) / 2016. Ed. STU. Pp 34 — 44.
[2] Weyrauch A. N., Izmailov R. A., Fotin B. S. “Compressor stations”: tutorial // Leningrad Polytechnic Institute — L., 1990 .- 84 c.
[3] Sadowski N. I., Kozhukhov Y.V. “Theory, calculation and design of the dynamic compressor. Test compressors in parallel and series operation. Collaboration compressors”: Proc. allowance. — SPb.: Publishing house of the Polytechnic. University Press, 2014. — 40 p.
[4] GOST 28567-90. Interstate standards. Compressors. Terms and Definitions. Compressors. Terms and definitions. — M .: Standartinform, 2005. — 30 liters.
[5] PB 03-581-03. Rules devices and safe operation of stationary compressor units, air ducts and pipelines. — M .: STC «Industrial safety». 2008 — 23.
[6] PB 03-576-03. Rules for operation and safety of the vessels working under pressure. — Gosgortechnadzor Russia. M .: PIO MBT. 2003. — 89 liters.
[7] Idelchik I. E.“Manual hydraulic resistance” / Ed. M.O. Shteynberg.- 3rd ed., Rev. and dop.- M.; Mechanical Engineering, 1992.


